The ERP that runs South Africa’s automotive, retail and warehousing businesses just got a major glow-up. Same engine. Brand-new interface. Now with SSL encryption end-to-end.
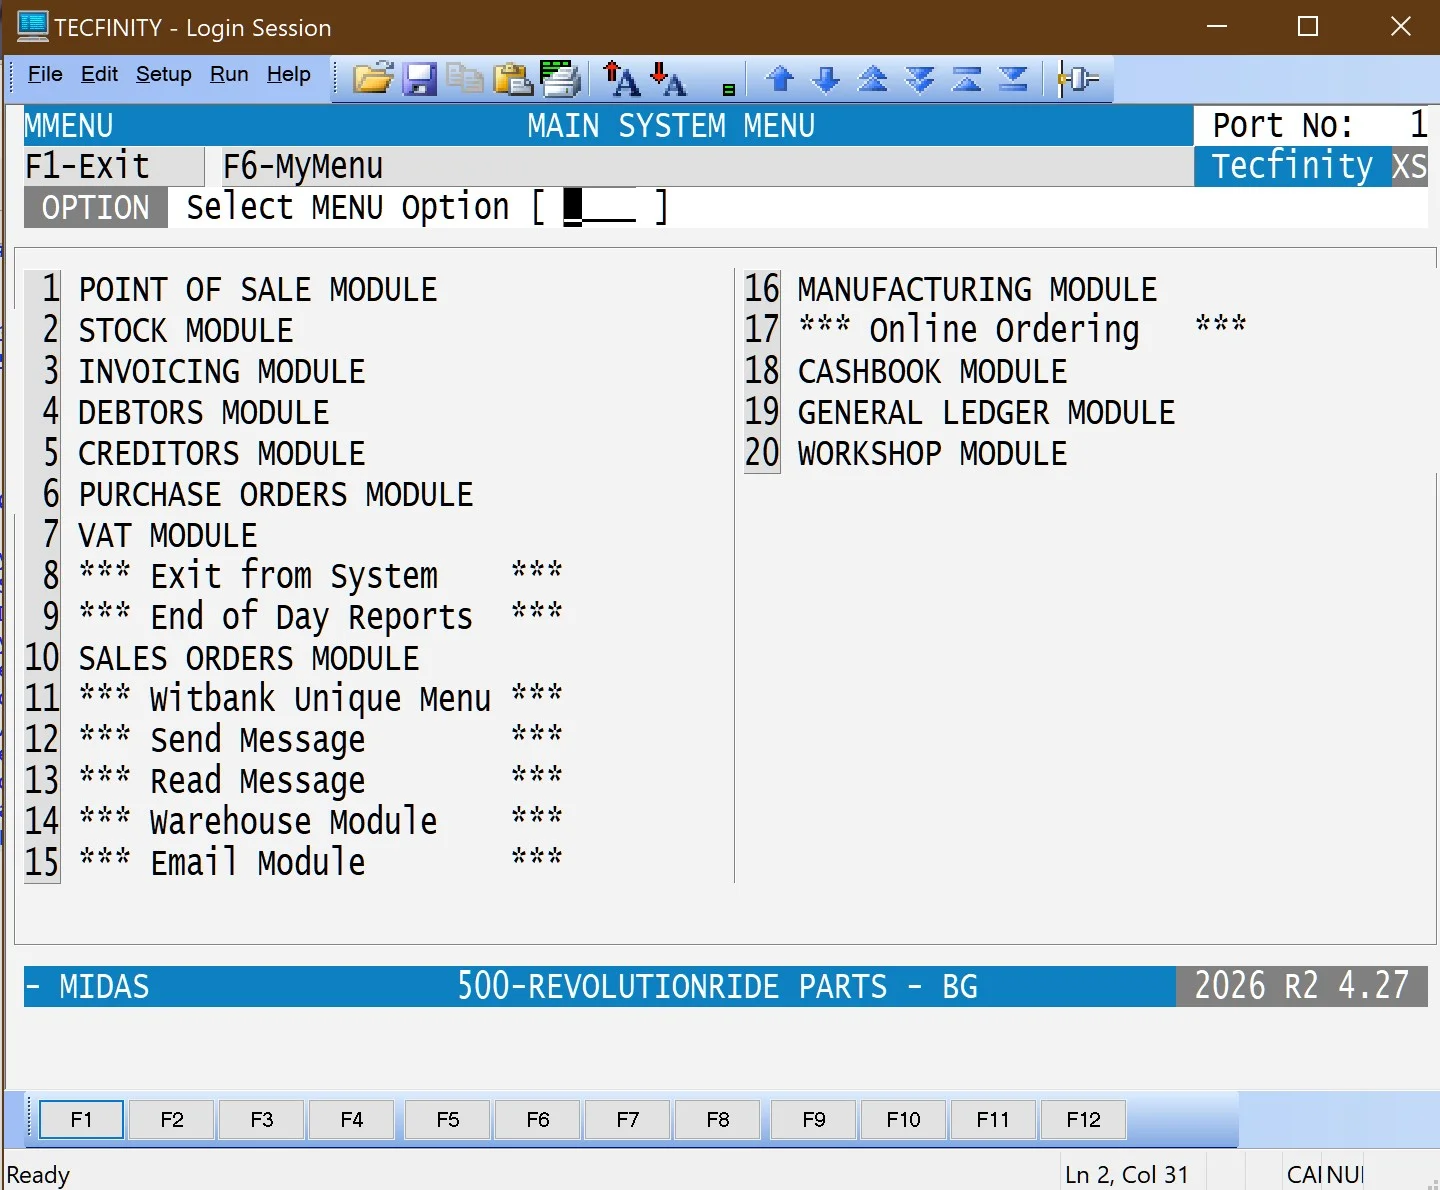
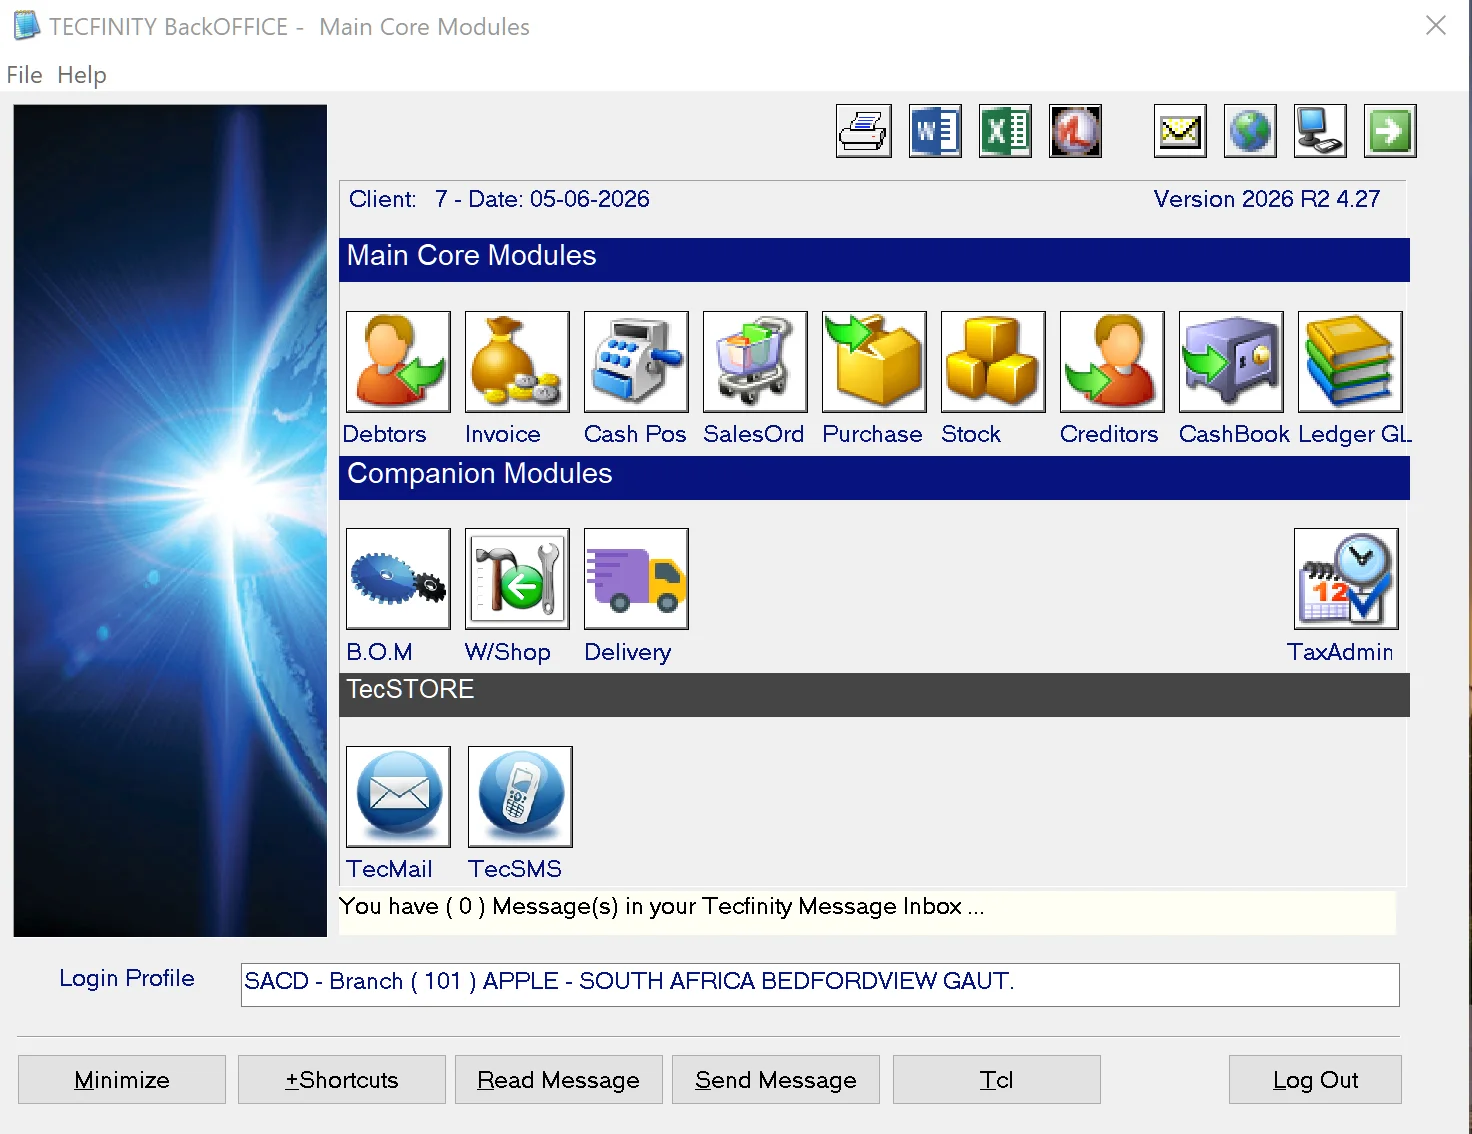
Drag the handle to reveal the difference between your old text interface and the new Windows GUI — using the Main System Menu as a live example.
◂ Text Interface · v2025Windows GUI · v2026 R2 ▸
v2025 · Textv2026 R2 · GUI
← Drag to compare →
What's inside
Six upgrades that
actually move the needle.
SSL Encryption, built in.
Every byte of customer data, financials, stock and transactions is encrypted in transit. Enterprise-grade security for sensitive business information — no add-ons required.
Full Windows GUI.
Clickable buttons, menus, icons, forms, easier navigation and far more user-friendly screens — compatible with every modern version of Windows.
Direct PDF.
Open reports straight to PDF. One click, every time.
Outlook Email.
Send reports without leaving the system
Dual Mode.
Keep the text UI for power users
Excel-ready data, instantly.
Export any report to Excel, Notepad or Wordpad. Spot sales trends, stock movement, best-performers and problem areas the moment they happen.
Stock Images.
See the actual part - not the part number.
Module by module
Every screen, rebuilt.
Same data, same logic, same shortcuts — wrapped in a modern Windows interface. Here’s the before-and-after across the modules your team uses every day.
01 / 10
Main System Menu · MMENU → BackOFFICE
From MMENU to BackOFFICE.
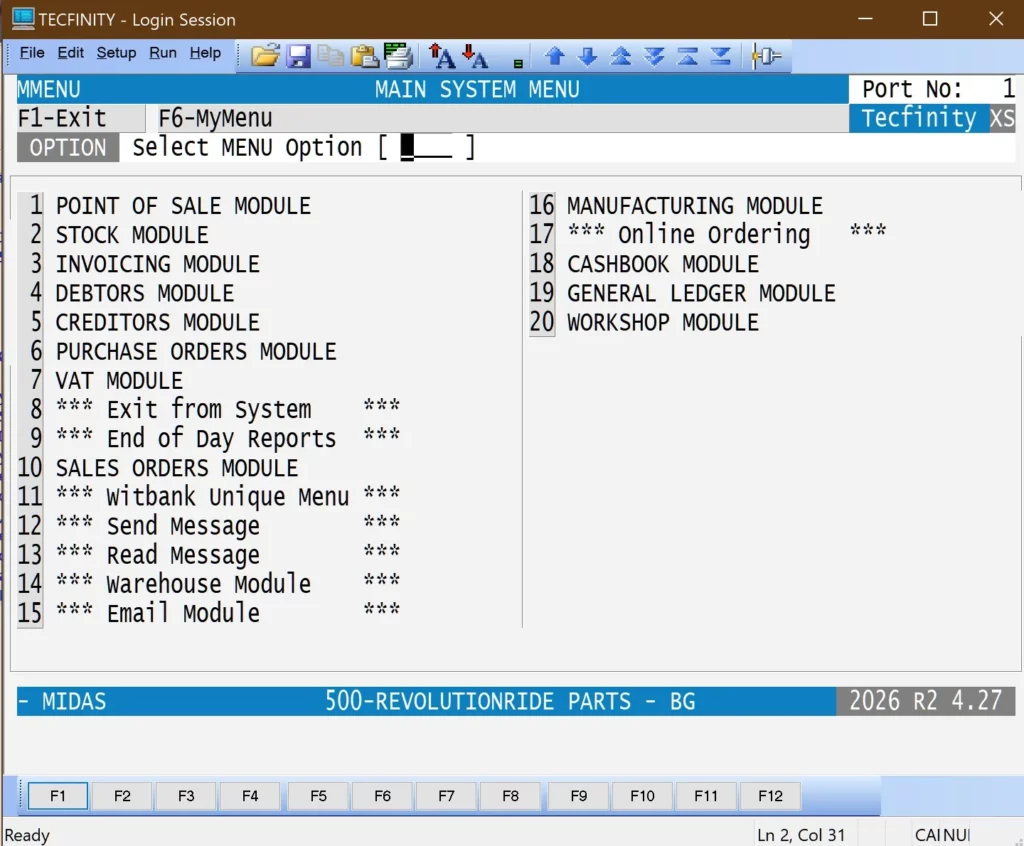
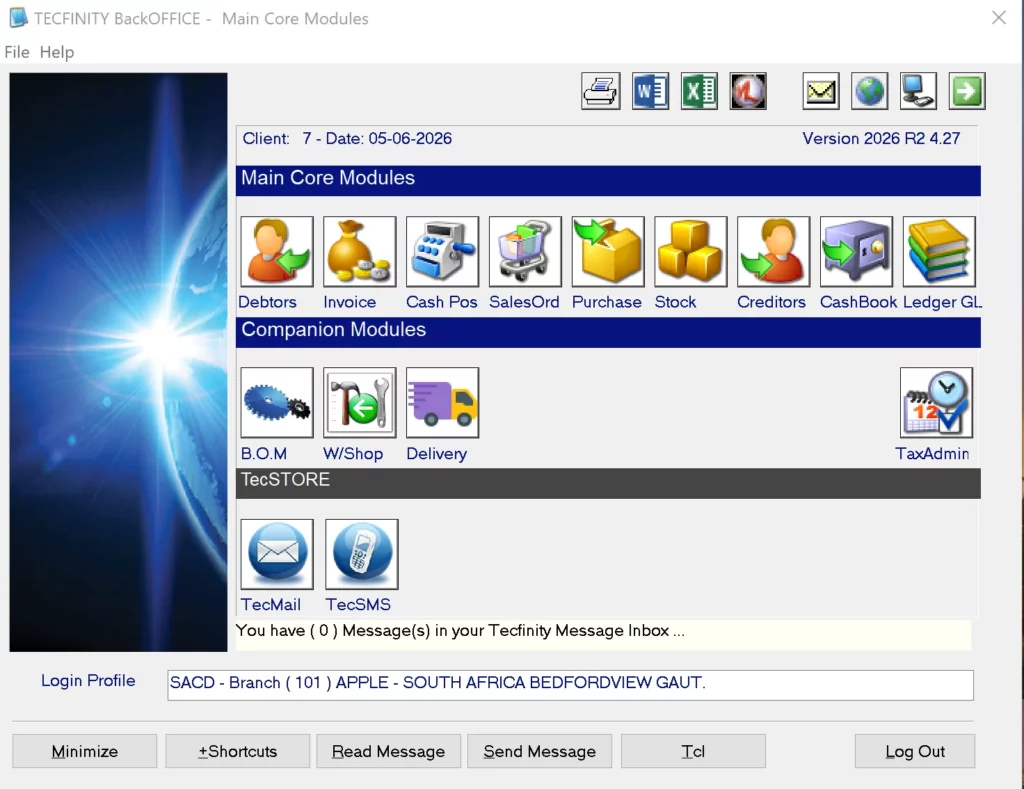
The same modules — Stock, Purchase Orders, Debtors, Sales Orders, Invoicing, Point of Sale, Creditors, Cashbook, General Ledger, Workshop, Manufacturing, Delivery — now launched from a clean icon-driven dashboard with shortcuts, messaging and login profiles built in.
Text interface
Windows GUI
02 / 10
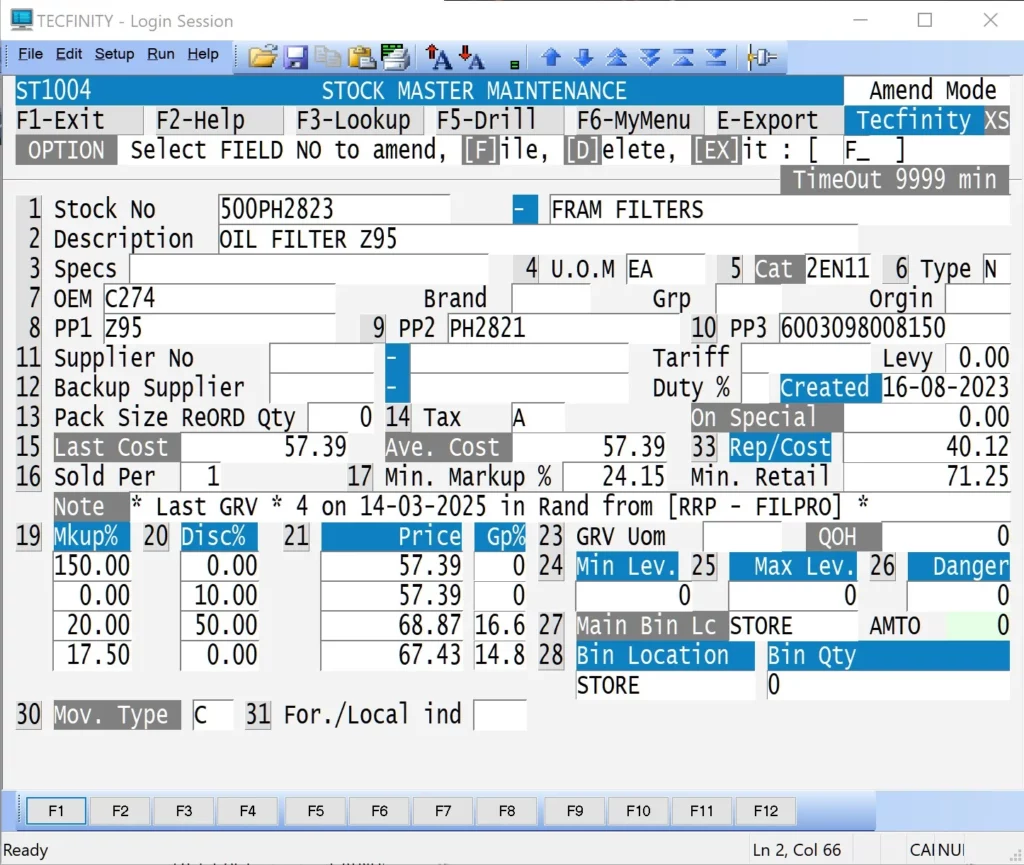
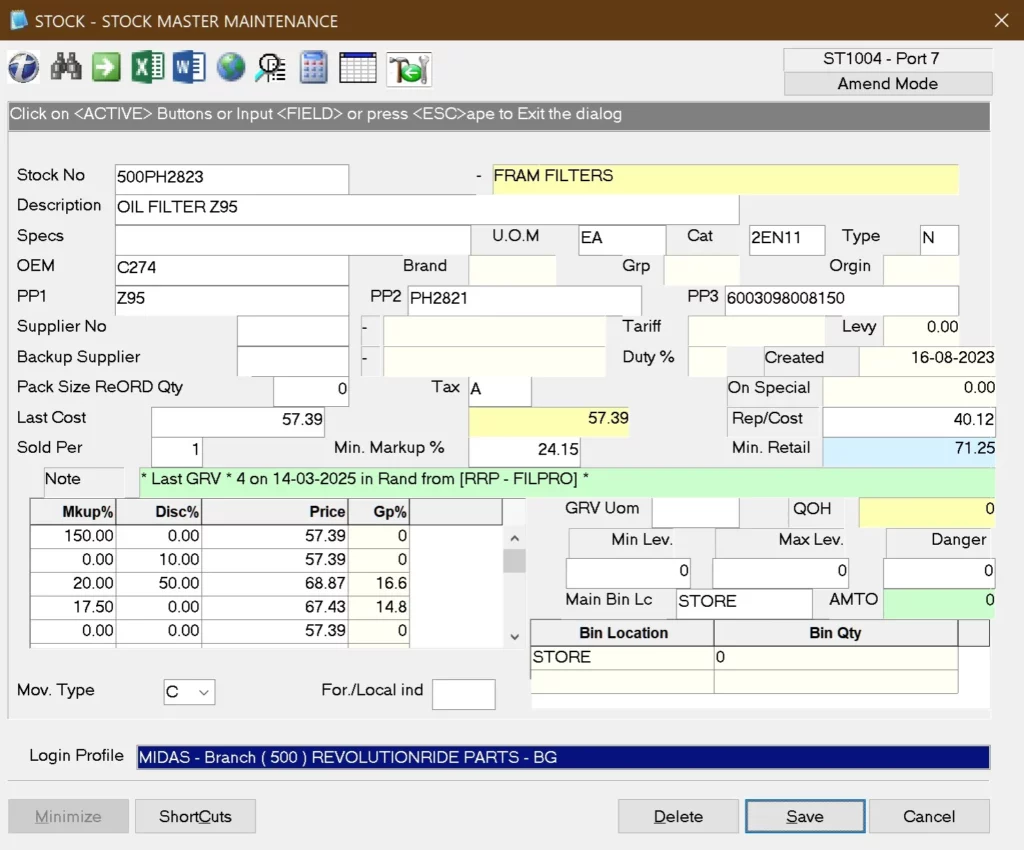
Stock Master Maintenance · ST1004
Stock records, finally readable.
Every field — Stock No, Description, Specs, UOM, OEM, Supplier, Pack Size, Cost, Markup, GRV history, Bin Location — laid out in clear form fields instead of colour-coded text positions. Same keystrokes still work for power users.
Text interface
Windows GUI
03 / 10
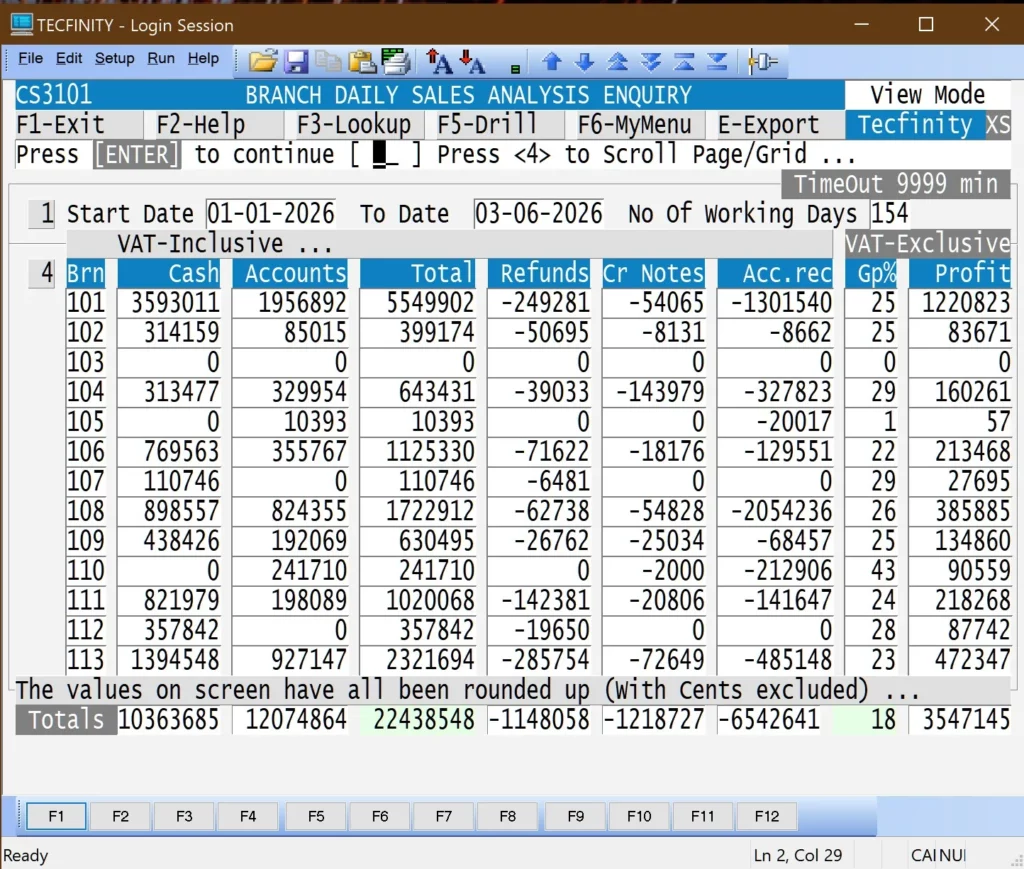
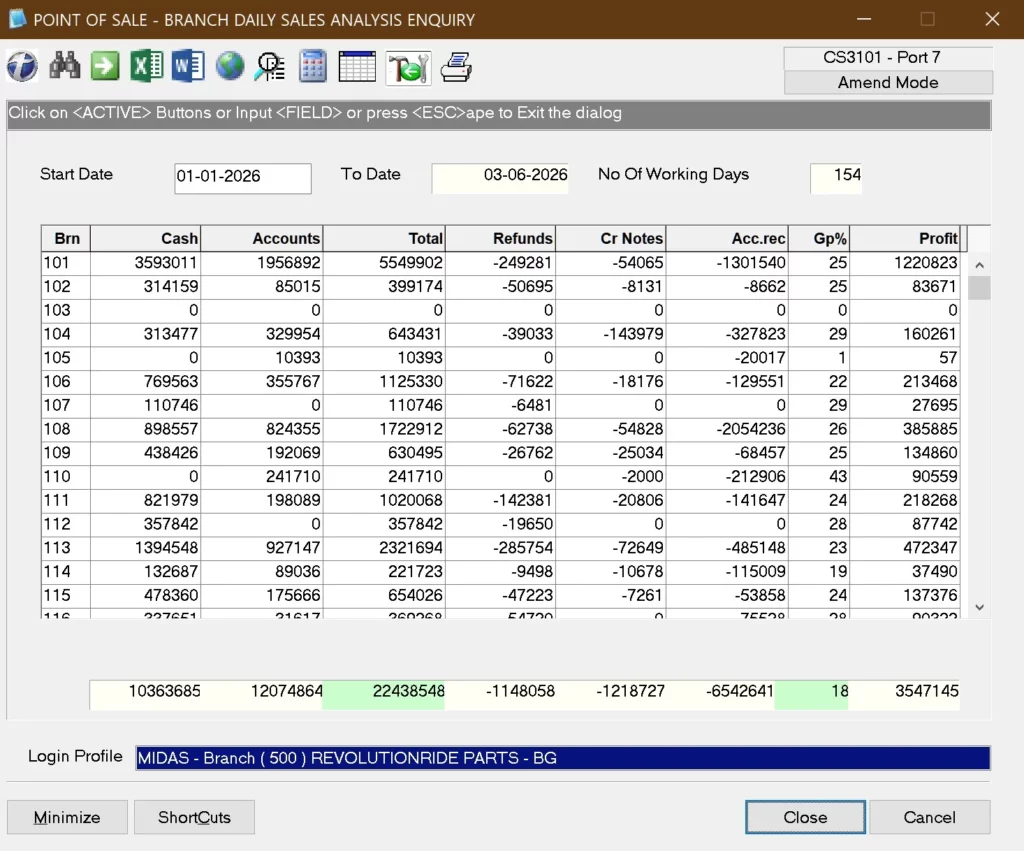
Branch Daily Sales Analysis · CS3101
Daily sales, at a glance.
Cash, accounts, totals, refunds, credit notes, accounts receivable, GP% and profit per branch — now in a sortable spreadsheet-style grid that exports straight to Excel for trend analysis.
Text interface
Windows GUI
04 / 10
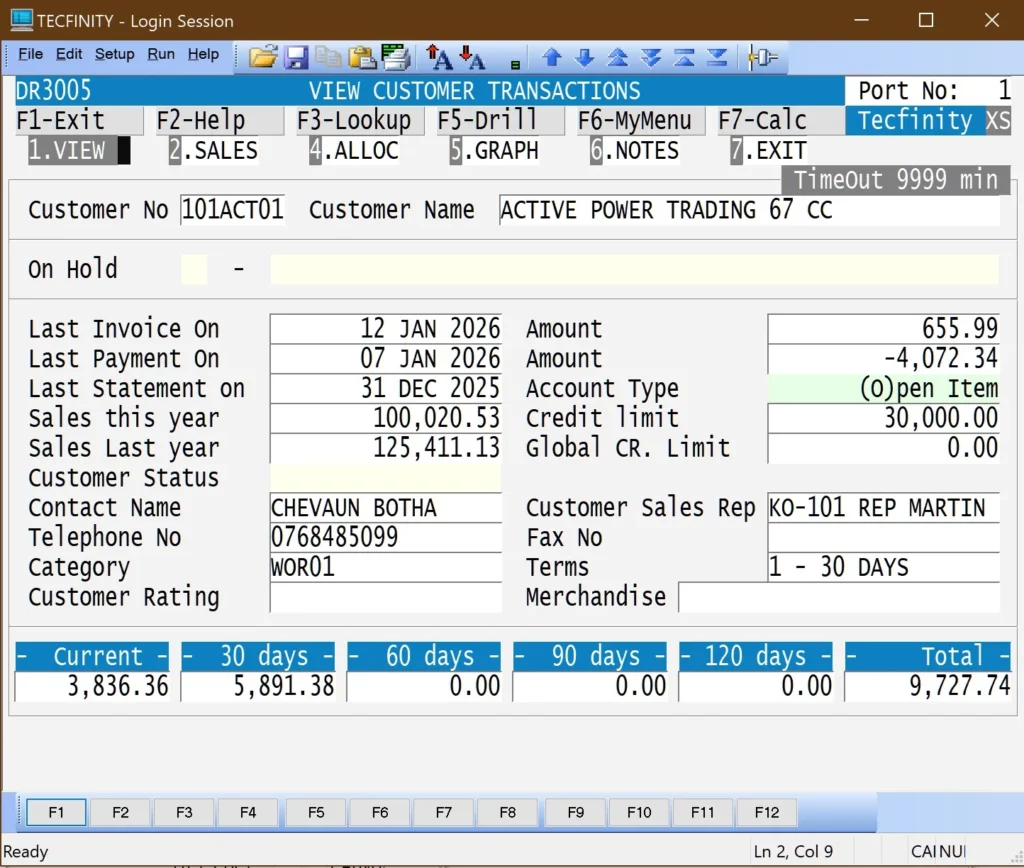
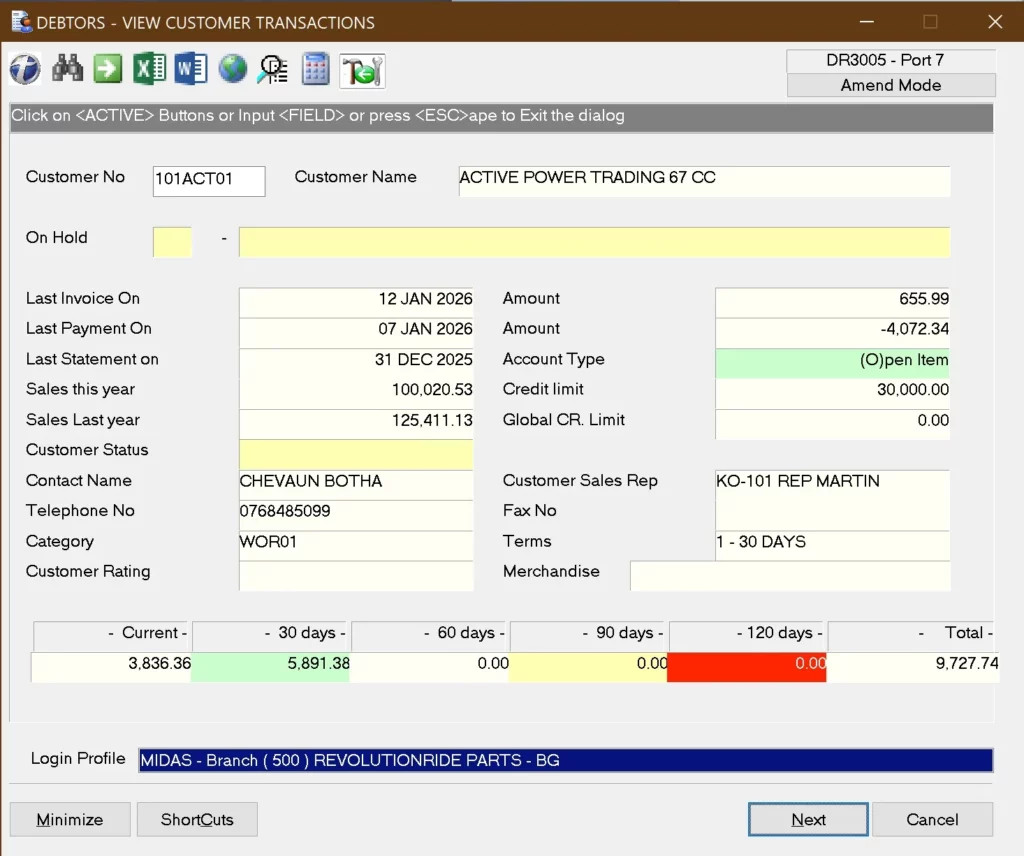
View Customer Transactions · DR3005
Customer accounts, decoded.
Last invoice, last payment, last statement, credit limits, sales this year vs last year, ageing buckets from current to 120+ days — all visible in a structured layout your team can scan in seconds. Risk bands colour-coded right in the grid.
Text interface
Windows GUI
05 / 10
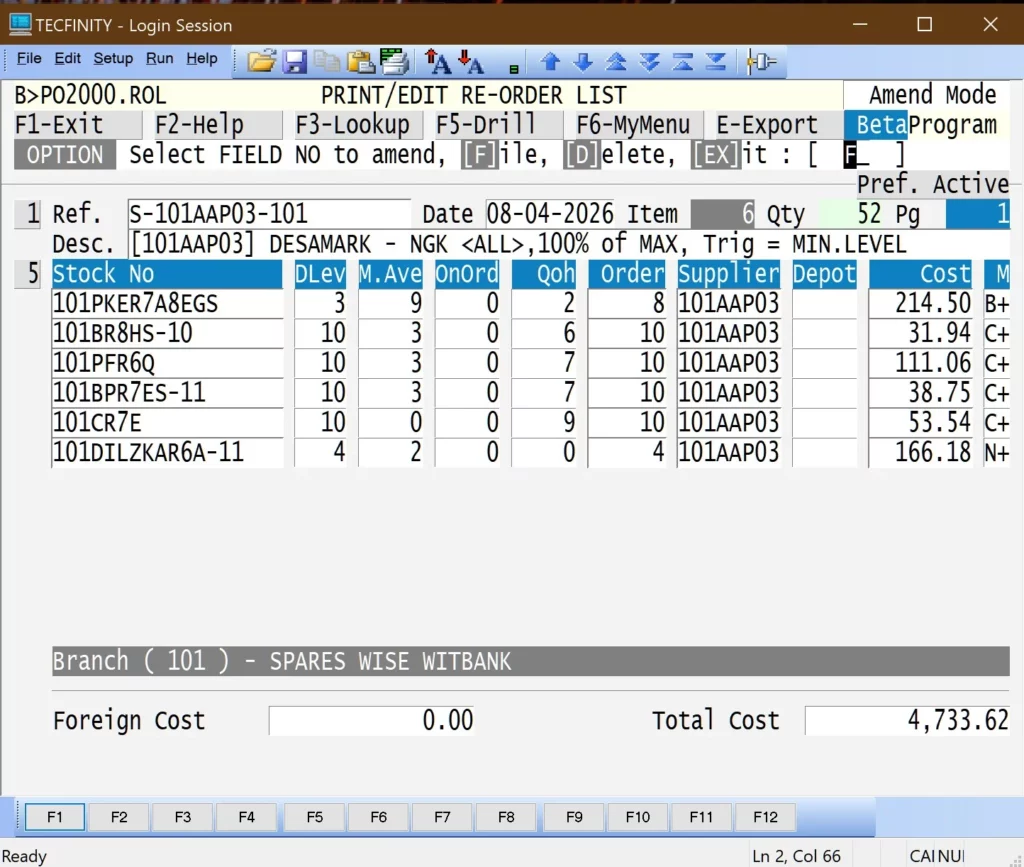
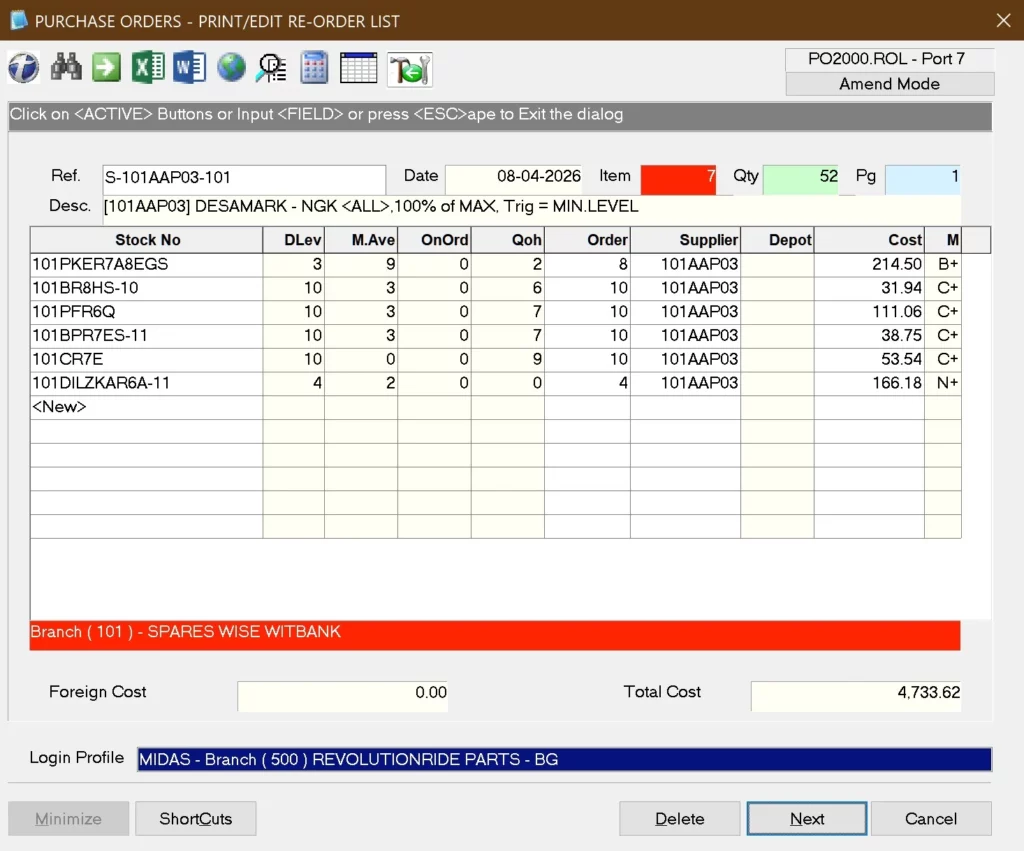
Print/Edit Re-Order List · PO2000.ROL
Re-orders, re-thought.
Demand levels, moving averages, on-order quantities, QOH, supplier and cost per line — now in a sortable grid so buyers can prioritise the right SKUs before stockouts cost the sale. Total cost and foreign cost live at the bottom.
Text interface
Windows GUI
06 / 10
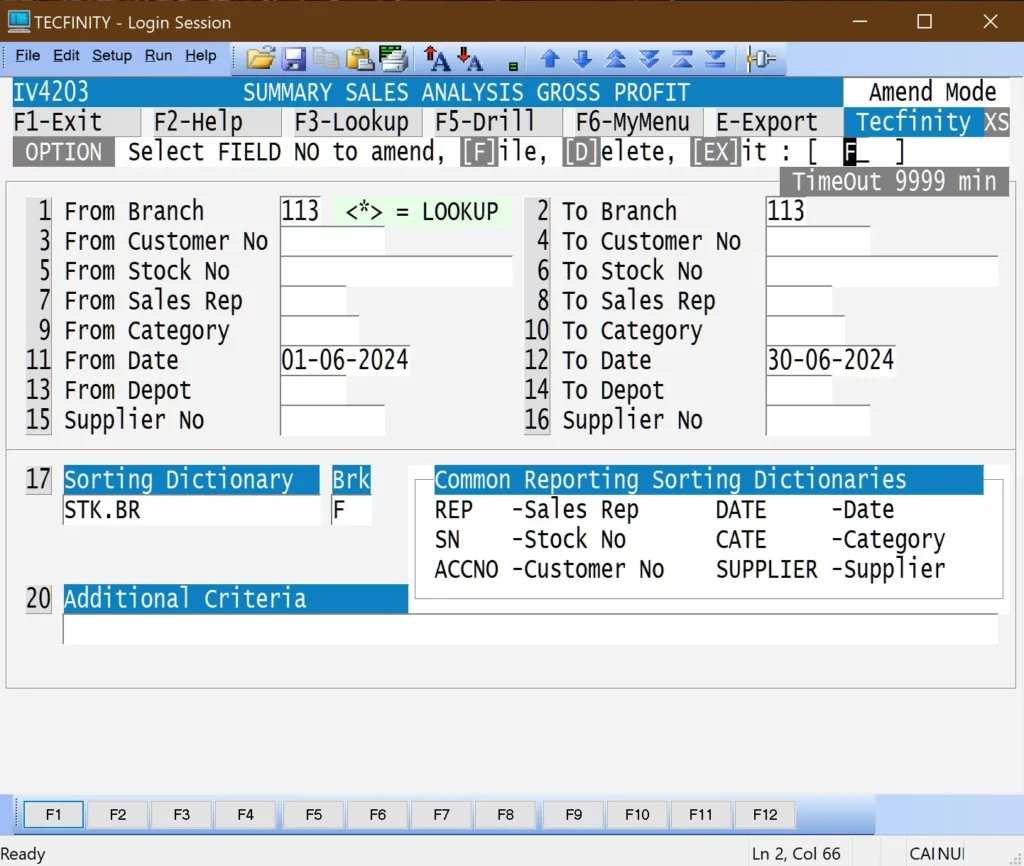
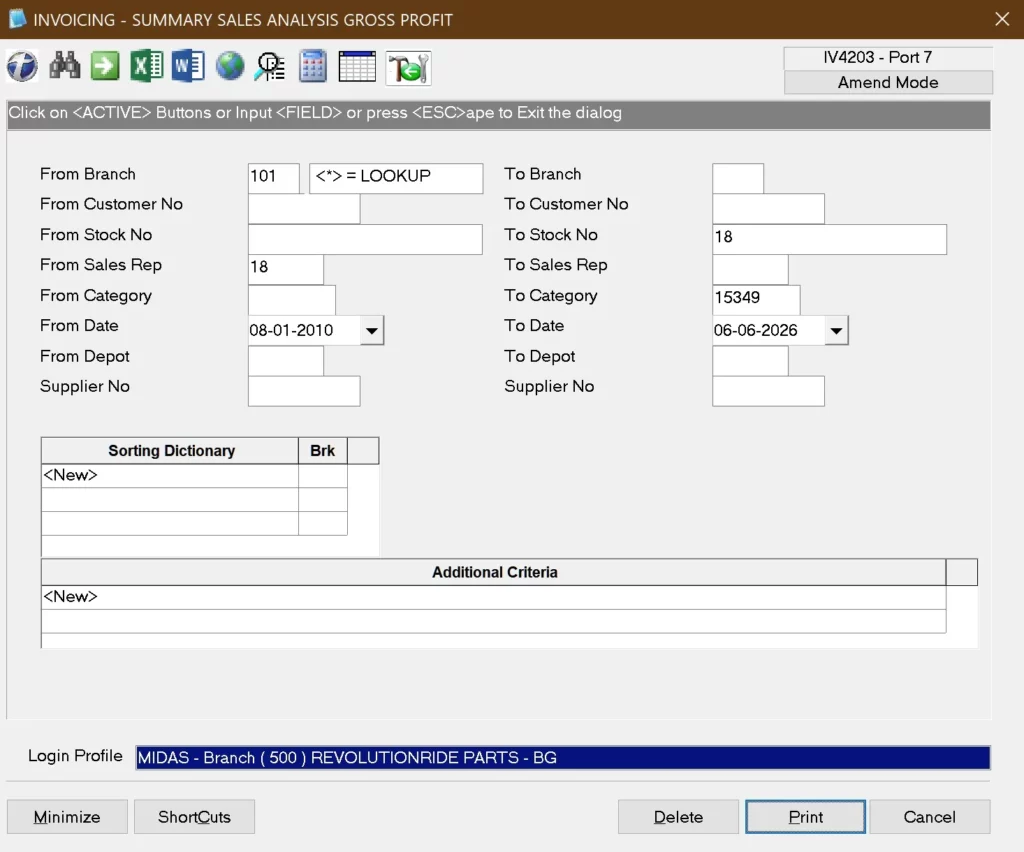
Summary Sales Analysis Gross Profit · IV4203
Reports without remembering field numbers.
From Branch, Customer, Stock, Sales Rep, Category, Date, Depot, Supplier — every filter is a labelled field with date pickers, lookups and Additional Criteria, instead of “Select FIELD NO to amend”.
Text interface
Windows GUI
07 / 10
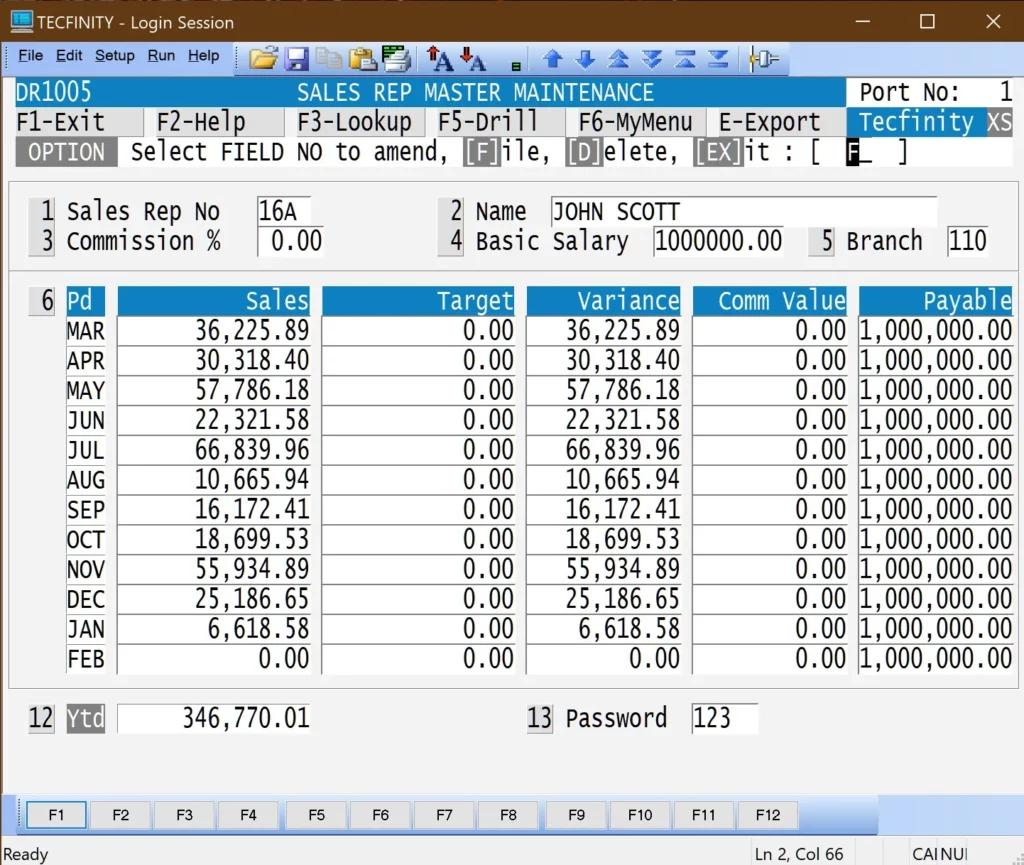
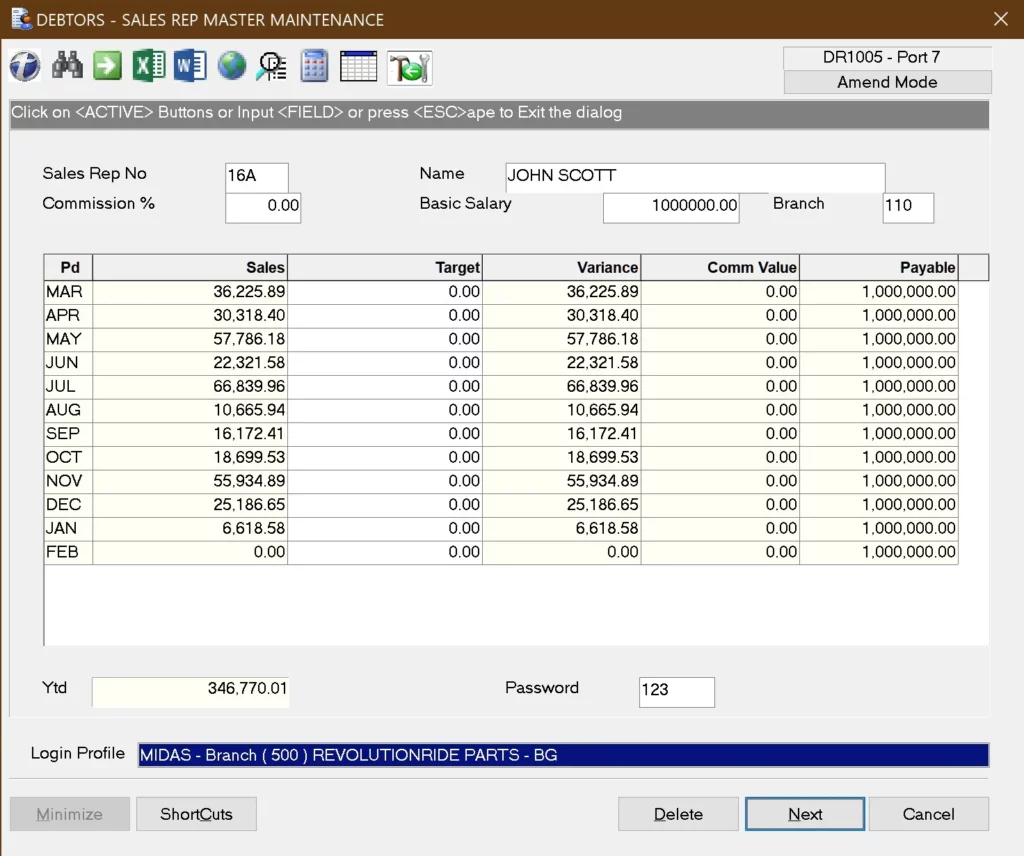
Sales Rep Performance · IV3202
Rep performance, side-by-side.
Monthly sales vs target, this year vs last year, commission percentage — all in a single grid. Drop straight into Excel to chart trends and compare rep performance across the year.
Text interface
Windows GUI
08 / 10
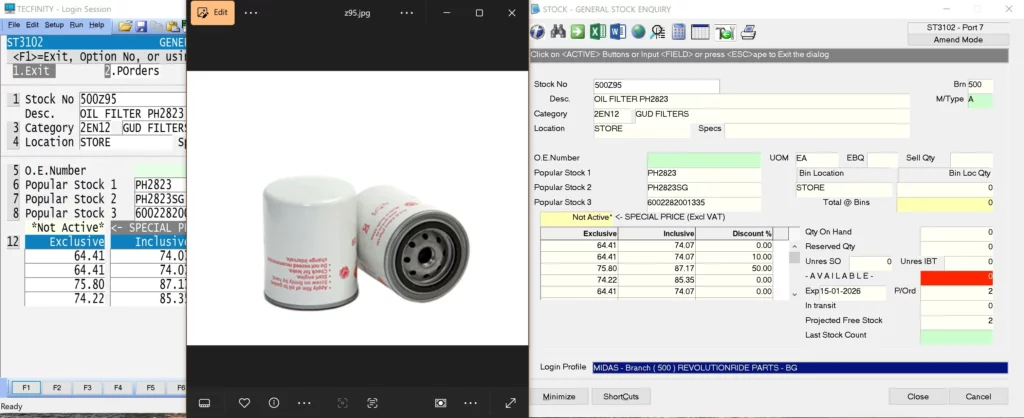
General Stock Enquiry · ST3102
See the part, not just the number.
Display stock pictures on-screen or email pictures via Outlook, with options to run in a Windows Interface or in the text interface you’re familiar with. No more guessing whether 101AVR901 is the right regulator — the image is right there next to the data.
Text interface
Windows GUI
09 / 10
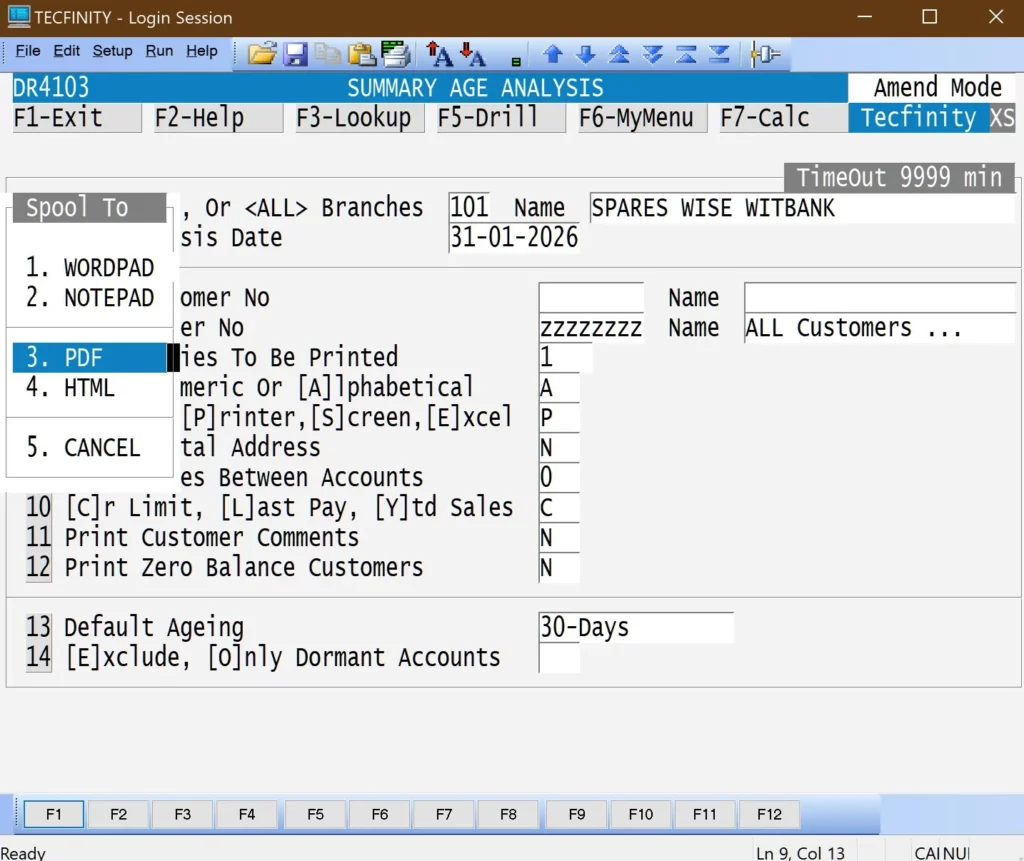
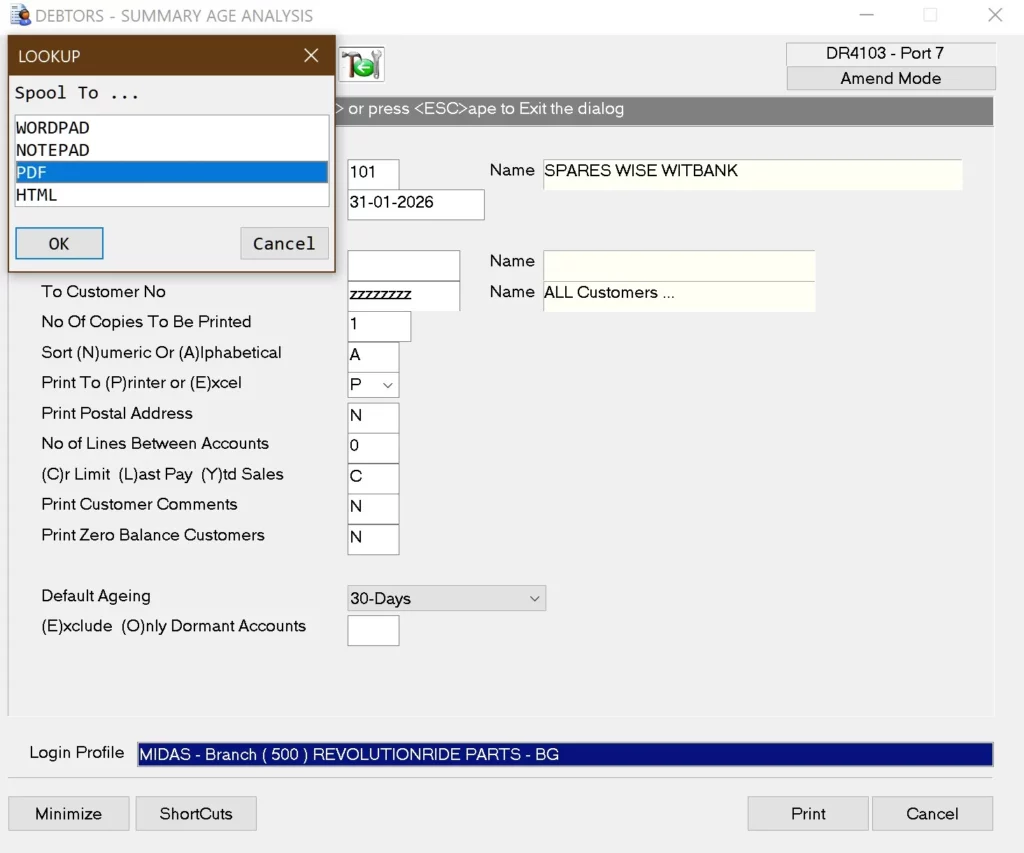
Debtors Summary Age Analysis · DR4103
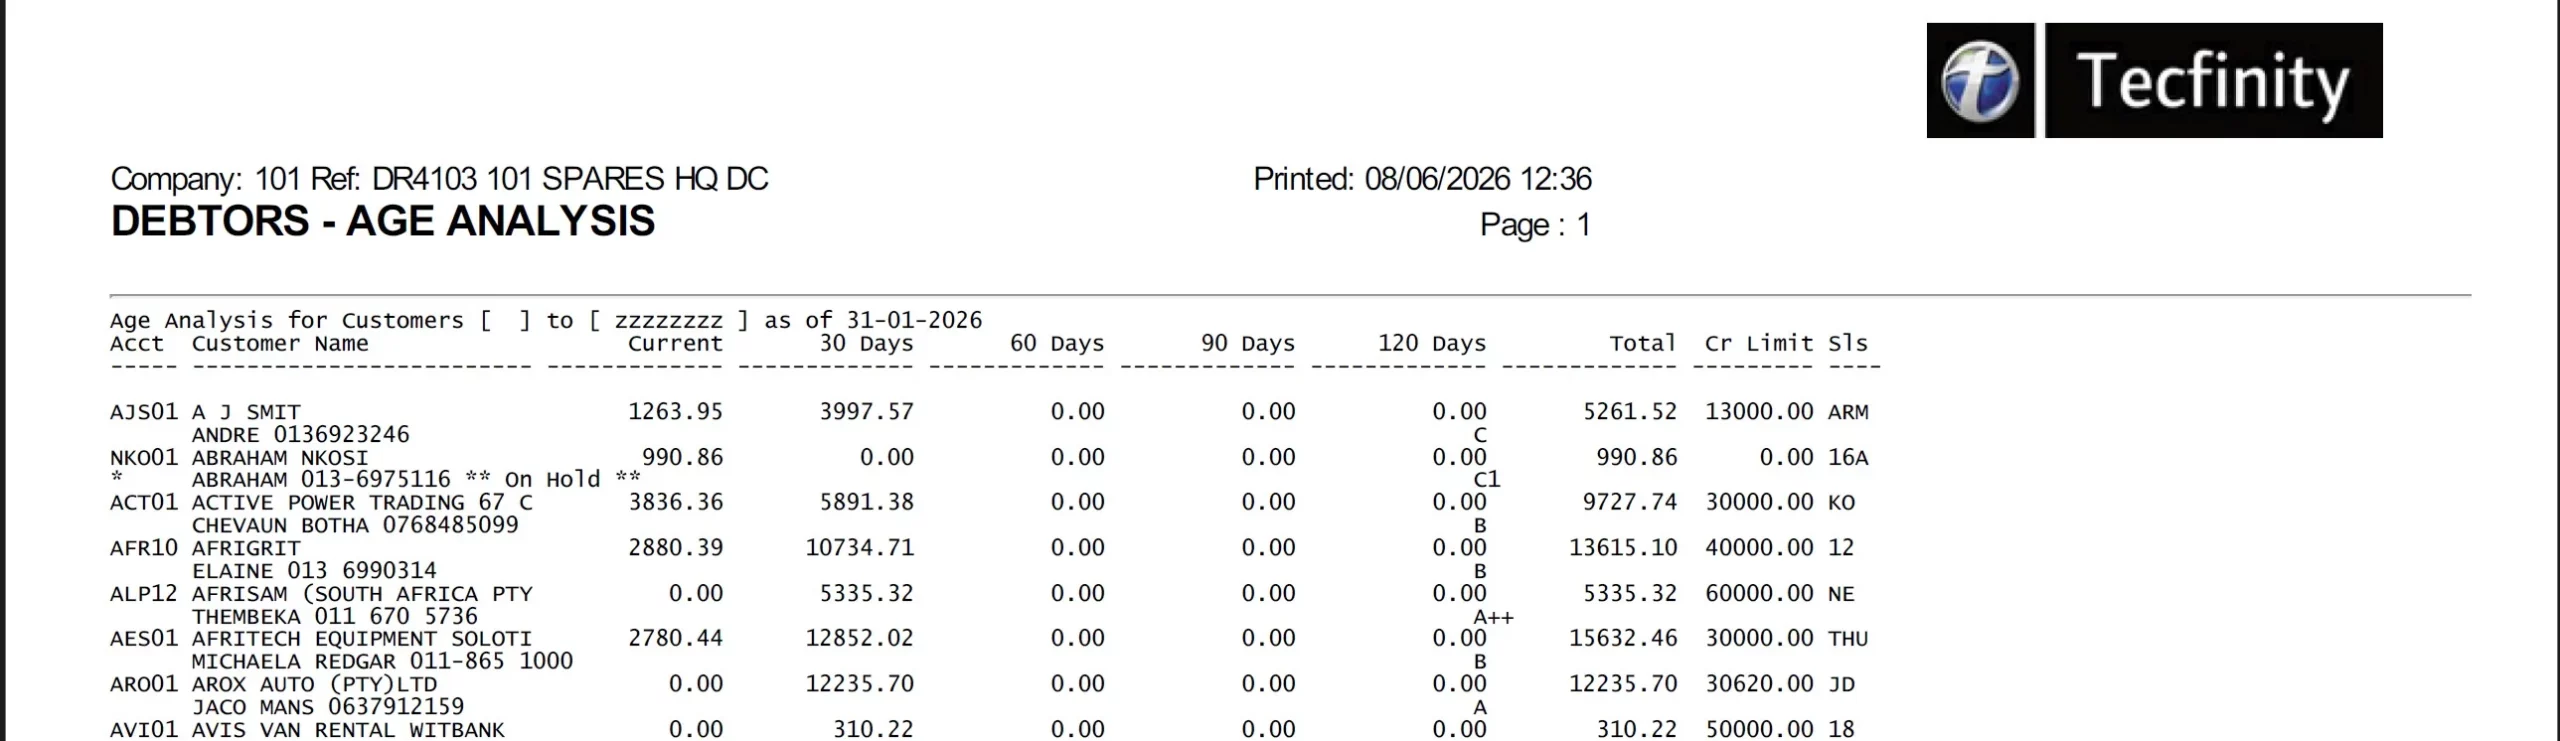
Open reports directly into PDF — and email them via Outlook.
Spool to Notepad, Wordpad, PDF or HTML in a single dialog. The PDF opens branded and print-ready, with the option to send it straight from Outlook without leaving Tecfinity. Below: the spool dialog in both interfaces, then the actual PDF output.
Text interface
Windows GUI
PDF Output
10 / 10
Creditors Summary Age Analysis · CR4102
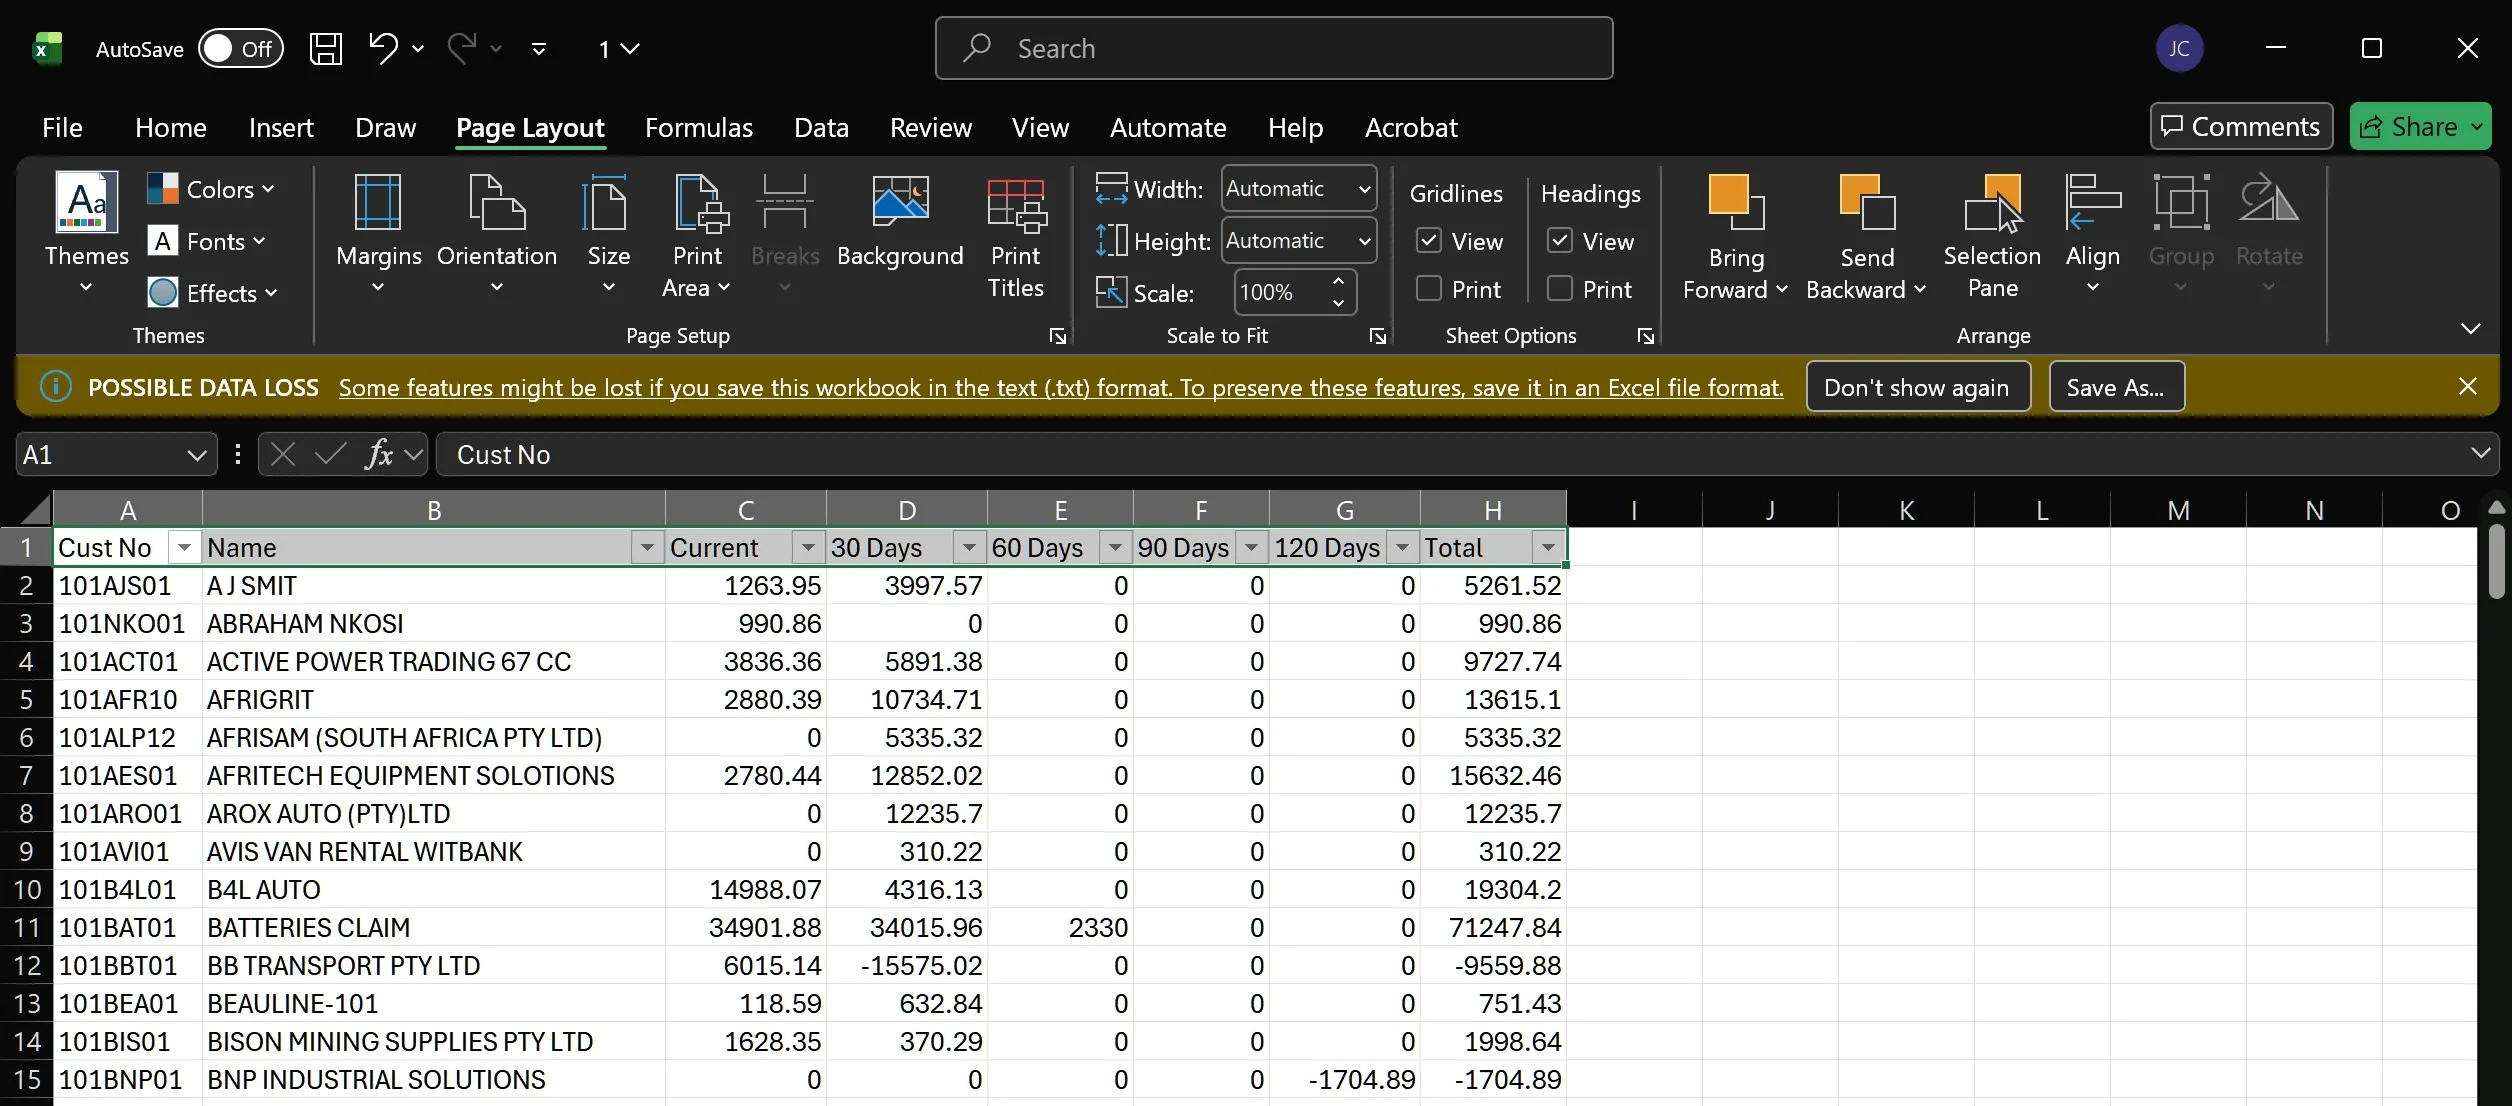
Export any report directly into Excel.
Data in Excel can easily be graphed — spot sales trends, stock movement, best-performers and problem areas the moment they happen. Notepad and Wordpad also supported for quick edits and notes.
Text interface
Windows GUI
Excel Output
Outcomes
More than an interface.
It's more accurate insight.
/ 01
Faster Reporting
From query to PDF in a single click. No spool dialogues, no exports, no waiting.
/ 02
Better Analysis
Drop straight into Excel and chart sales, stock and margin trends in seconds.
/ 03
Easier Decisions
Visual dashboards mean managers spot what matters before it costs the business.
/ 04
Less Manual Work
Cut the keystrokes. Cut the errors. Free staff to focus on customers and sales.
Ready to see the 2026 R2 difference?
20 minutes with our team. We’ll show you exactly what changes — and what stays the same.